Trace element and radiological characterisation of ash and soil at a legacy site in the former Raša coal-mining area
, ,  Profilo Orcid, , e
Iva Božičević Mihalić
Ruđer Bošković Institute, Laboratory for Ion Beam InteractionsZagreb, Croatia
Profilo OrcidCerca questo autore su
29 dic 2024
INFORMAZIONI SU QUESTO ARTICOLO
Categoria dell'articolo: Original article
Pubblicato online: 29 dic 2024
Pagine: 245 - 258
Ricevuto: 01 set 2024
Accettato: 01 nov 2024
DOI: https://doi.org/10.2478/aiht-2024-75-3897
Parole chiave
© 2024 Tomislav Bituh et al., published by Sciendo
This work is licensed under the Creative Commons Attribution-NonCommercial-NoDerivatives 3.0 License.
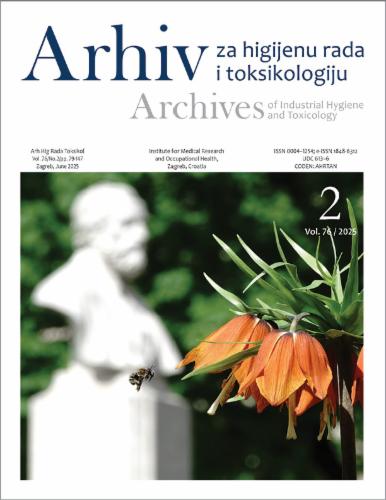
Figure 1
![Overview of the research area. a) the geographical position of the Istrian Peninsula (North Adriatic Sea) and Štrmac settlement (orange circle); b) aerial view of the study area with marked sampling locations [yellow diamonds denote the first field campaign (May 2019) and blue diamonds the second (July 2019)]; c) the Štrmac coal burning waste disposal site; d) vertical B2 sampling profile with three subsamples – B2a, B2b, B2c; e) hill side with visible layers of progradation (the length of the vertical white line in d and e is 120 cm)](https://sciendo-parsed.s3.eu-central-1.amazonaws.com/676a92f27306cc7e8721e319/j_aiht-2024-75-3897_fig_001.jpg?X-Amz-Algorithm=AWS4-HMAC-SHA256&X-Amz-Content-Sha256=UNSIGNED-PAYLOAD&X-Amz-Credential=AKIA6AP2G7AKOUXAVR44%2F20250915%2Feu-central-1%2Fs3%2Faws4_request&X-Amz-Date=20250915T112215Z&X-Amz-Expires=3600&X-Amz-Signature=d76611a67ea2751fe979d9d537ab37a065d97a13600e393a868a623ce4de8236&X-Amz-SignedHeaders=host&x-amz-checksum-mode=ENABLED&x-id=GetObject)
Figure 2

Figure 3

Mean radium equivalent indices (Raeq), absorbed dose rates (Ḋ), and annual effective doses (E) in soil and ash samples at the Štrmac legacy site calculated from activity concentrations of activity concentration of 226Ra, 232Th, and 40K
| Sample type | Raeq (Bq/kg) | E (mSv/year) | |
|---|---|---|---|
| Ash (n=19) | 399 (122–751) | 184 (57–346) | 0.23 (0.07–0.42) |
| Soil (n=6) | 153 (80–213) | 71 (38–99) | 0.09 (0.05–0.12) |
Comparison between measured and certified values for standard reference materials SRM 2710 and PTXRFIAEA08 Natural Soil*
| Element | SRM 2710 | Natural soil | ||||
|---|---|---|---|---|---|---|
| Mean±SD | Certified value ± error | Relative error (%) | Mean ± SD | Certified value ± error | Relative error (%) | |
| Mg | 0.8±0.2 | 0.853±0.04 | -6.3 | - | - | - |
| Al | 6.5±0.2 | 6.44±0.08 | 1.1 | 17.99±0.06 | 15.2±0.4 | 18.4 |
| Si | 27.0±0.3 | 29.0±0.2 | -6.8 | 17.68±0.06 | 18.7±0.4 | -5.4 |
| S | 0.26±0.01 | 0.240±0.006 | 8.1 | 0.109±0.05 | 0.071±0.004 | 54.5 |
| K | 2.03±0.04 | 2.1±0.1 | -3.7 | 0.023±0.003 | 0.034±0.002 | -33.1 |
| Ca | 1.12±0.02 | 1.25±0.03 | -10.3 | - | - | - |
| Fe | 3.28±0.03 | 3.4±0.1 | -3.1 | 8.82±0.03 | 9.0±0.3 | -2.2 |
| Na | 9000±400 | 11400±600 | -21.3 | - | - | - |
| P | 1400±200 | 1060±150 | 30.7 | - | - | - |
| Ti | 2670±60 | 2830±100 | -5.7 | 9200±100 | 9410±380 | -1.9 |
| V | 90±20 | 76.6±2.3 | 21.5 | 280±50 | 270±19 | 4.7 |
| Cr | 80±30 | 39 | 98.0 | 30±20 | 31±3 | 6.7 |
| Mn | 9700±200 | 10100±400 | -4.1 | 180±30 | 174±13 | 2.8 |
| Ni | 21±2 | 14.3±1 | 49.2 | - | - | - |
| Cu | 3150±40 | 2950±130 | 6.7 | 50±10 | 36±3.4 | 48.1 |
| Zn | 7100±100 | 6952±91 | 1.6 | 40±10 | 69±6 | -34.2 |
| Ga | - | - | - | 50±20 | 33±3 | 45.9 |
| As | 400±100 | 626±38 | -27.6 | - | - | - |
| Se | - | - | - | 60±40 | 2.3±0.3 | 2354.1 |
| Br | 250±50 | 15±2 | 1524.0 | - | - | - |
| Sr | - | - | - | 30±30 | 4.6±0.6 | 562.3 |
| Zr | - | - | - | 200±50 | 266±18 | -23.8 |
| Ba | 540±70 | 707±51 | -23.5 | - | - | - |
| Hg | 140±80 | 33±2 | 316.2 | - | - | - |
| Pb | 6800±200 | 5532±80 | 22.1 | - | - | - |
Ranking of sampling locations by measured S and V levels (from highest to lowest)
| Sampling location | S (%) | Sampling location | V (mg/kg) |
|---|---|---|---|
| 12 | 6 | ||
| 1 | 1 | ||
| 6 | 8 | ||
| 8 | 2 | ||
| 9 | 3 | ||
| 2 | 9 | ||
| 11 | 0.176 | 5 | 140 |
| 10 | 0.156 | 10 | 140 |
| 3 | 0.09 | 12 | 130 |
| 5 | 0.09 | 11 | 120 |
| 7 | 0.06 | 7 | 90 |
Trace element concentrations (in mg/kg) in measured soil samples with limits of detection (LOD) for each element and comparison with trace element concentrations obtained with HR-ICP-MS in one sample taken close to location 1 reported by Petrović (48)
| Soil Samples | Cu | Zn | As | Se | Br | Rb | Sr | Y | Pb |
|---|---|---|---|---|---|---|---|---|---|
| 180±50 | 70±20 | 20±10 | 20±10 | 30±10 | -- | 550±20 | 60±20 | 70±40 | |
| 73±9 | 120±10 | -- | -- | 30±30 | 210±40 | 250±30 | -- | 120±90 | |
| 51±6 | 160±50 | -- | -- | -- | 360±50 | 70±50 | -- | 130±20 | |
| 44±8 | 130±10 | -- | -- | 60±30 | 330±40 | 140±30 | -- | 200±100 | |
| 86±8 | 130±10 | -- | -- | 40±20 | 130±30 | 210±30 | -- | 170±80 | |
| 30±30 | 90±10 | -- | -- | 20±20 | 120±20 | 504±6 | -- | 90±60 | |
| 39±8 | 110±10 | -- | 20±20 | 60±30 | 260±40 | 100±30 | -- | 200±100 | |
| 37±7 | 120±10 | -- | -- | -- | 230±40 | 130±20 | -- | 110±90 | |
| 24±8 | 100±10 | -- | 40±20 | 30±30 | 220±40 | 90±20 | -- | 100±100 | |
| 41±7 | 100±10 | -- | 23±9 | -- | 180±30 | 130±20 | -- | 140±90 | |
| 72±9 | 13±7 | 20±10 | -- | -- | -- | 580±40 | -- | -- | |
| 37.8 | 120 | 14.8 | 21.8 | -- | -- | 128 | -- | 48.2 | |
| 10 | 20 | 20 | 30 | 40 | 50 | 30 | 20 | 90 |
Minor and trace element concentrations (in mg/kg) in measured soil samples with limits of detection (LOD) for each element and comparison with trace element concentrations obtained with HR-ICP-MS in one sample taken close to location 1 reported by Petrović (48)
| Soil samples | Na | P | Cl | Ti | V | Cr | Mn | Co | Ni |
|---|---|---|---|---|---|---|---|---|---|
| -- | -- | -- | 1180±70 | 200±10 | 160±40 | 200±100 | -- | 20±10 | |
| 1600±100 | 600±60 | 140±30 | 4170±70 | 150±20 | 450±40 | 1490±60 | -- | 140±10 | |
| 2300±100 | 760±60 | 120±10 | 5030±80 | 150±20 | 300±100 | 1700±100 | -- | 159±6 | |
| 2600±100 | 740±60 | 150±30 | 5390±70 | 140±20 | 350±30 | 2170±70 | 170± 30 | 144±9 | |
| 2000±100 | 130±60 | 200±30 | 4510±70 | 210±20 | 320±40 | 1000±50 | -- | 104±8 | |
| 1230±40 | 400±100 | 160±60 | 2600±200 | 90±10 | 400±200 | 500±40 | -- | 82±4 | |
| 3300±100 | 1470±70 | 130±30 | 4850±70 | 200±20 | 380±30 | 1770±60 | -- | 100±10 | |
| 2400±100 | 890±70 | 230±30 | 4740±70 | 150±20 | 270±30 | 1340±60 | -- | 126±8 | |
| 4000±200 | 800±70 | 120±30 | 6070±80 | 140±20 | 570±40 | 1370±60 | -- | 110±8 | |
| 3800±200 | 1350±80 | 400±40 | 5810±80 | 120±20 | 380±30 | 2180±70 | -- | 85±8 | |
| -- | -- | 100±30 | 710±60 | 130±20 | 100±60 | 360±80 | -- | -- | |
| -- | -- | -- | -- | 183 | 167 | -- | -- | 96.3 | |
| 200 | 100 | 50 | 40 | 50 | 50 | 60 | 200 | 10 |
Sample labels and geographical coordinates
| 1st field campaign (May 2019) | |||
|---|---|---|---|
| Sample label | Sample type | Geographical coordinates | |
| 0 | Soil | 45° 7' 14.40"N | 14° 7' 36.86" E |
| 1 | 45° 7' 10.80"N | 14° 7' 40.40" E | |
| 2 | 45° 7' 9.98"N | 14° 7' 41.97" E | |
| 3 | 45° 7' 8.87" N | 14° 7' 43.53" E | |
| 5 | 45° 7' 11.41" N | 14° 7' 46.35" E | |
| 6 | 45° 7' 13.12" N | 14° 7' 44.07" E | |
| 7 | 45° 7' 13.55" N | 14° 7' 48.76" E | |
| 8 | 45° 7' 11.09" N | 14° 7' 44.22" E | |
| 9 | 45° 7' 14.97" N | 14° 7' 48.27" E | |
| 10 | 45° 7' 16.45" N | 14° 7' 49.44" E | |
| 11 | 45° 7' 17.60" N | 14° 7' 50.48" E | |
| 12 | Ash | 45° 7'10.88" N | 14° 7'39.14" E |
| 13 | |||
| 14 | 45° 7' 11.31" N | 14° 7' 38.83" E | |
| 15 | |||
Measured elements in this study (mg/kg) compared to world soils and Croatian legislation
| Element | This research (mg/kg) | Croatian legislation ( |
World soils ( |
World soils ( |
Topsoil Europe ( |
Geochemical atlas ( |
|---|---|---|---|---|---|---|
| Al | 11700–92200 | 80000 | 78500 | |||
| As | 20 | 30 | 5 | 6.83 | 11.6 | 18 |
| Br | 20 |
10 | 10 | |||
| Ca | 8620–290000 | 14000 | 13300 | |||
| Cl | 100–400 | 300 | 300 | |||
| Co | 170 |
60 | 10 | 11.3 | 10.4 | 18 |
| Cr | 100–570 | 120 | 80 | 59.5 | 94.8 | 121 |
| Cu | 24–180 | 120 | 25 | 38.9 | 17.3 | 35.5 |
| Fe | 9300–49200 | 35000 | 41800 | |||
| K | 150–10500 | 14000 | 12500 | |||
| Mg | 8900–15000 | 9000 | 6800 | |||
| Mn | 200–2180 | 530 | 488 | 524 | 1082 | |
| Na | 1230–4000 | 10000 | 3400 | |||
| Ni | 20–159 | 75 | 20 | 29 | 37 | 74.6 |
| P | 130–1470 | 750 | 650 | |||
| Pb | 70 |
150 | 17 | 32 | 48.7 | |
| Rb | 120–360 | 65 | 68 | 87 | ||
| S | 600–82600 | 800 | ||||
| Se | 20 |
0.3 | 0.44 | |||
| Si | 22000–311100 | 280000 | ||||
| Sr | 70–580 | 240 | 130 | 86 | ||
| Ti | 710–6070 | 4000 | 7038 | 6070 | 4300 | |
| V | 90–200 | 90 | 129 | 68 | 148 | |
| Y | 60 | 20 | 23 | 23 | 28 | |
| Zn | 13 |
200 | 70 | 267 | 68.1 | 108 |
Major and minor element concentrations (in %) in measured soil samples with limits of detection (LOD) for each element
| Soil samples | Mg | Al | Si | S | K | Ca | Fe |
|---|---|---|---|---|---|---|---|
| 1.5±0.1 | 2.3±0.2 | 2.2±0.1 | 3.6±0.2 | 0.015±0.09 | 29±3 | 1.58±0.02 | |
| 1.25±0.01 | 7.91±0.03 | 22.82±0.07 | 0.180±0.005 | 1.45±0.01 | 7.21±0.03 | 4.22±0.04 | |
| 1.29±0.004 | 9.22±0.03 | 26±1 | 0.09±0.01 | 1.5±0.1 | 1.11±0.03 | 4.92±0.06 | |
| 1.13±0.01 | 8.85±0.03 | 27.90±0.09 | 0.09±0.004 | 1.43±0.01 | 0.984±0.009 | 4.73±0.08 | |
| 0.82±0.01 | 6.3±0.02 | 19.32±0.03 | 2.94±0.01 | 0.763±0.008 | 6.94±0.02 | 3.44±0.02 | |
| 1.03±0.03 | 5.3±0.1 | 16±1 | 0.06±0.01 | 1.25±0.03 | 19.4±0.04 | 2.574±0.08 | |
| 1.03±0.01 | 8.34±0.04 | 28.4±0.1 | 0.293±0.006 | 1.43±0.01 | 1.31±0.01 | 4.33±0.07 | |
| 1±0.01 | 7.88±0.03 | 30.5±0.1 | 0.227±0.006 | 1.34±0.01 | 1.26±0.01 | 4.1±0.08 | |
| 0.98±0.01 | 8.76±0.03 | 31.11±0.08 | 0.156±0.006 | 1.34±0.01 | 0.862±0.09 | 4.43±0.09 | |
| 0.89±0.01 | 8.24±0.04 | 26.9±0.01 | 0.176±0.006 | 1.29±0.01 | 1.19±0.01 | 3.95±0.07 | |
| 1.25±0.02 | 1.17±0.01 | 1.16±0.01 | 8.26±0.04 | -- | 26.2±0.1 | 0.93±0.01 | |
| 0.01 | 0.007 | 0.006 | 0.007 | 0.005 | 0.01 | 0.002 |
Mean, minimum, and maximum activity concentrations (Bq/kg) of natural radionuclides in soil and ash samples from Štrmac
| Sample type | 238U | 232Th | 226Ra | 210Pb | 40K | |
|---|---|---|---|---|---|---|
| Activity concentration (Bq/kg) | ||||||
| Soil | Average±SD | 80±33 | 44±19 | 61±23 | 179±70 | 381±127 |
| Min | 50 | 21 | 23 | 52 | 134 | |
| Max | 138 | 67 | 81 | 239 | 464 | |
| Ash | Average±SD | 403±174 | 22±12 | 355±125 | 255±84 | 162±67 |
| Min | 88 | 7 | 96 | 49 | 36 | |
| Max | 828 | 44 | 681 | 393 | 319 | |
Pollution indices of selected elements in respect to reference values from Table 6 used in PI calculation*
| Variables | Croatian ordinance ( |
World soils ( |
World soils ( |
Topsoil Europe ( |
Geochemical atlas of Croatia ( |
|---|---|---|---|---|---|
| As | 0.67 | 4 | 2.93 | 1.72 | 1.11 |
| Co | 2.83 | 17 | 15.04 | 16.35 | 9.44 |
| Cu | 1.5 | 7.2 | 4.63 | 10.4 | 5.07 |
| Cr | 4.75 | 7.13 | 9.58 | 6.01 | 4.71 |
| Fe | 1.41 | 1.18 | |||
| Mn | 4.11 | 4.47 | 4.16 | 2.01 | |
| Ni | 2.12 | 7.95 | 5.48 | 4.3 | 2.13 |
| Pb | 0.93 | 8.24 | 4.38 | 2.87 | |
| S | 103.25 | ||||
| Se | 133.33 | 90.91 | |||
| Sr | 2.42 | 4.46 | 6.74 | ||
| V | 2.22 | 1.55 | 2.94 | 1.35 | |
| Zn | 0.8 | 2.29 | 0.6 | 2.35 | 1.48 |
Activity concentrations (Bq/kg) of natural radionuclides in soil and ash samples from Štrmac
| Sample code | Sample type | 238U | 232Th | 226Ra | 210Pb | 40K | |
|---|---|---|---|---|---|---|---|
| Activity concentration ± relative uncertainty (Bq/kg) | |||||||
| 1st field campaign | |||||||
| 0 | Soil | 99±7 | 22±2 | 81±1 | 231±47 | 134±4 | |
| 2 | 58±6 | 44±2 | 44.1±0.9 | 52±47 | 433±10 | ||
| 6 | 62±8 | 57±2 | 58.9±0.8 | 160±31 | 446±10 | ||
| 7 | 50±4 | 20.8±0.9 | 23.2±0.6 | 171±33 | 354±9 | ||
| 9 | 72±6 | 51±2 | 75±1 | 219±37 | 453±11 | ||
| 11 | 138±9 | 67±3 | 81±1 | 238±37 | 464±12 | ||
| 14 | Ash | 458±10 | 17±2 | 349±3 | 288±29 | 302.6±0.9 | |
| 15 | 372±9 | 16±2 | 314±3 | 240±46 | 319±1 | ||
| 2nd field campaign | |||||||
| A1 | Ash | 605±13 | 44±2 | 295±2 | 306±24 | 188±4 | |
| A2a | 567±10 | 34±2 | 440±2 | 318±20 | 183±6 | ||
| A2b | 413±10 | 32±3 | 465±4 | 260±42 | 149±7 | ||
| A3a | 440±15 | 42±3 | 551±3 | 341±31 | 173±7 | ||
| A3b | 828±19 | 41±2 | 681±3 | 393±29 | 140±6 | ||
| A3c | 401±12 | 29±2 | 376±2 | 303±24 | 162±7 | ||
| B1a | 663±15 | 18±1 | 405±3 | 392±26 | 147±5 | ||
| B1b | 306±8 | 16±1 | 341±2 | 227±27 | 147±6 | ||
| B2a | 340±9 | 18±1 | 332±3 | 240±40 | 36±2 | ||
| B2b | 308±8 | 13±1 | 316±2 | 168±31 | 137±8 | ||
| B2c | 403±9 | 21±2 | 396±3 | 296±25 | 55±3 | ||
| B3a | 304±7 | 7±1 | 326±2 | 230±37 | 141±6 | ||
| B3b | 459±12 | 13±1 | 318±3 | 251±24 | 160±5 | ||
| C1 | 88±6 | 10±2 | 96±1 | 49±39 | 147±5 | ||
| C2 | 211±7 | 27±2 | 274±2 | 149±19 | 226±6 | ||
| D1 | 236±11 | 18±2 | 236±2 | 204±35 | 153±6 | ||
| D2 | 250±7 | 9±1 | 225±2 | 193±33 | 118±5 | ||